
Course analytics is the practice of tracking learner behaviour and revenue signals inside your course business, activation, engagement, drop-off, completion, refunds, so you know what to fix and when. The single next action after any launch is simple: pull the cohort dashboard for your most recent group of students and check two numbers first.
Start here, in order of urgency:
- Activation rate: what percentage started lesson one within 48 hours of buying?
- First-drop lesson: which specific lesson loses the most people?
- Completion rate: what share of enrolled students finish the course?
- Average revenue per student (ARPS): is it climbing or flat across cohorts?
- Refund rate: is it above 5%, and does it cluster around a particular lesson or price point?
Pro Tip: If you only check one number a week, make it activation. A cohort that fails to start rarely recovers later, and it's the earliest warning sign you'll get that something in your sales page or onboarding oversold the course.
Key Takeaways
Course analytics protects revenue by turning lesson-level drop-off, activation and refund data into specific, testable fixes rather than guesswork.
| Point | Details |
|---|---|
| Check activation first | It's the earliest predictor of completion and the fastest signal that onboarding needs work. |
| Cohort before you diagnose | Splitting by launch, channel, language or price tier reveals problems a blended average hides. |
| Run one experiment at a time | Test a single change, such as a shortened lesson, and measure before/after on the same cohort. |
| Treat refunds as a metric, not noise | A refund rate clustered around one lesson points to a specific fix, not general dissatisfaction. |
| Use a platform built for both data and commerce | BibliOWLteca connects cohort dashboards, multi-currency payments and exports so analytics and revenue sit in one place. |
Table of Contents
- Core kursuse analüütika metrics every creator should track
- How to set up tracking: events, cohorts and exports
- Turning drop-off data into fixes that protect revenue
- How BibliOWLteca supports analytics-based course operations
- Privacy and data compliance in course analytics
- Data quality: making sure your numbers can be trusted
- Case studies: what analytics-led fixes actually look like
- Predictive analytics and machine learning in course performance
- Connecting course analytics to your LMS, CRM and marketing tools
- A habit worth borrowing from creators who do this well
- Get the analytics and commerce tools in one place
- Frequently asked questions
- Sources
Core kursuse analüütika metrics every creator should track
Kursuse analüütika, the Estonian term for course analytics, boils down to a handful of numbers that tell you whether a course is working commercially and pedagogically. Treat them as a ladder rather than a list: activity data comes first, performance data second, outcome data last, and each layer builds on the one below it, according to a three-layer analytics framework used across learning platforms.
Here's the working glossary:
- Enrolment: total purchases or sign-ups in a given period. It tells you demand, nothing about experience.
- Activation: the share of buyers who start lesson one. A single first-lesson-start event is the highest-leverage metric most creators can implement, and it predicts completion better than almost anything else.
- Engagement: session frequency, time on lesson, or video watch-through. Useful for spotting stalled momentum before someone drops out entirely.
- Lesson-level drop-off: where, precisely, students stop. This is the metric that turns a vague "completion is low" complaint into a fixable problem.
- Completion rate: the percentage who finish. Industry ranges vary wildly by course type, so treat any published benchmark as a starting point, not a target.
- Assessment performance: quiz or assignment scores by lesson, flagging content that's unclear rather than just hard.
- Refund rate: a leading indicator of mismatched expectations, not just buyer's remorse.
- Repeat purchase or upsell rate: whether finishers come back for more, which says more about course quality than any survey.
- ARPS: total revenue divided by enrolled students, the cleanest single number for commercial health.
The most useful analytics view stitches these into one journey, from enrolment through to retention and repeat purchases, rather than treating each metric as an isolated report.
How to set up tracking: events, cohorts and exports
Good kursuse analüütika depends on instrumentation, not intuition. Before you can diagnose anything, you need clean events flowing into a system you can actually query.
- Record the core events. At minimum: purchase, enrolment, first lesson started, each subsequent lesson started and completed, quiz attempted and scored, refund issued, and upsell purchased.
- Assign a consistent user identifier. Every event needs to tie back to the same learner ID across purchase, platform login and email system, or your cohort comparisons will quietly fall apart.
- Build cohorts around variables that matter commercially. Launch date, acquisition channel, language version and price tier each behave differently, and cohort comparisons routinely reveal performance gaps that a blended average hides completely.
- Name events consistently. "lesson_complete" and "LessonCompleted" are the same event to a human and two different events to a spreadsheet.
- Set up exports or webhooks early. Whether you're pushing data to a spreadsheet or a BI tool, instrumentation gaps such as missing user IDs or duplicate purchase events are the single biggest cause of cohort data you can't trust.
Pro Tip: Run a test purchase through your own funnel every time you change a checkout page or add a lesson. It takes five minutes and it's the fastest way to catch a broken tracking pixel before it costs you a month of blind data.
The direction of travel across course platforms is towards live, interactive dashboards rather than static monthly exports, with real-time views and predictive flags for at-risk learners becoming a standard expectation rather than a premium feature. If your current setup only gives you a PDF once a month, that's worth fixing before you worry about anything more advanced.
Turning drop-off data into fixes that protect revenue
Numbers on a dashboard don't fix anything on their own. The workflow that actually moves the needle runs in a loop: detect a signal, cohort it, inspect the lesson-level detail, form a hypothesis, test a small change, and measure the result before rolling it out further.
- Detect. A cohort's completion rate drops 15 points compared to the previous launch.
- Cohort. Split by acquisition channel and language to check whether the drop is universal or confined to one segment.
- Inspect. Look at lesson-level drop-off and quiz scores for that cohort specifically, not the course average.
- Hypothesise. If the drop is concentrated in lesson three, ask what changed there, pacing, unclear instructions, a broken download link.
- Test. Make one change and hold everything else constant.
- Measure. Compare the next cohort's numbers against the same lesson before rolling the fix out course-wide.
Certain patterns show up often enough to be worth memorising:
- Early activation drop, within the first lesson, usually points to a mismatch between what the sales page promised and what the course delivers, or a clunky onboarding sequence.
- Mid-course drop-off is often a single overloaded lesson trying to do too much; splitting it into two shorter lessons is a cheap fix worth testing first.
- Low quiz scores clustered on one topic usually mean the explanation needs revising, not that students aren't trying.
Small, fast experiments compound. A tweaked onboarding email or a shortened first lesson rarely transforms a course overnight, but tested repeatedly across launches, these changes reliably shift activation and completion in the same direction. That matters commercially: a revenue audit approach that combines net revenue per course with completion and refund data usually finds more leaking revenue than a pricing change ever would. Strategies for improving how you monetise and scale a course tend to work best once this diagnostic loop is already running, rather than before.
How BibliOWLteca supports analytics-based course operations
Diagnosing drop-off and running experiments only works if the underlying platform actually gives you the data. BibliOWLteca provides a secure and scalable infrastructure for creators to publish and manage courses, e-books and storefronts, with the commerce and content layers connected rather than bolted together.
In practice, that means a creator can:
- Pull a cohort revenue report to see ARPS by launch date without exporting three separate systems into one spreadsheet.
- Compare completion rates by language version, useful for anyone selling the same course into multiple markets with multi-currency payments.
- Export quiz performance data for deeper analysis in an external tool when a pattern needs more scrutiny than a dashboard chart allows.
Analytics only earns its keep when the numbers connect back to a specific lesson, a specific cohort, and a specific action. A platform that houses commerce and course delivery together makes that connection far easier to see.
Built-in tax compliance and global payment handling also mean fewer manual reconciliation steps between "what analytics says I sold" and "what actually landed in the account", which matters more than it sounds once you're running cohorts across several currencies at once.
Privacy and data compliance in course analytics
Tracking learner behaviour means handling personal data, and that comes with obligations, not just opportunities. If you sell to students in the European Union, learner data such as email addresses, progress records and quiz scores falls under GDPR, regardless of where your business is registered.
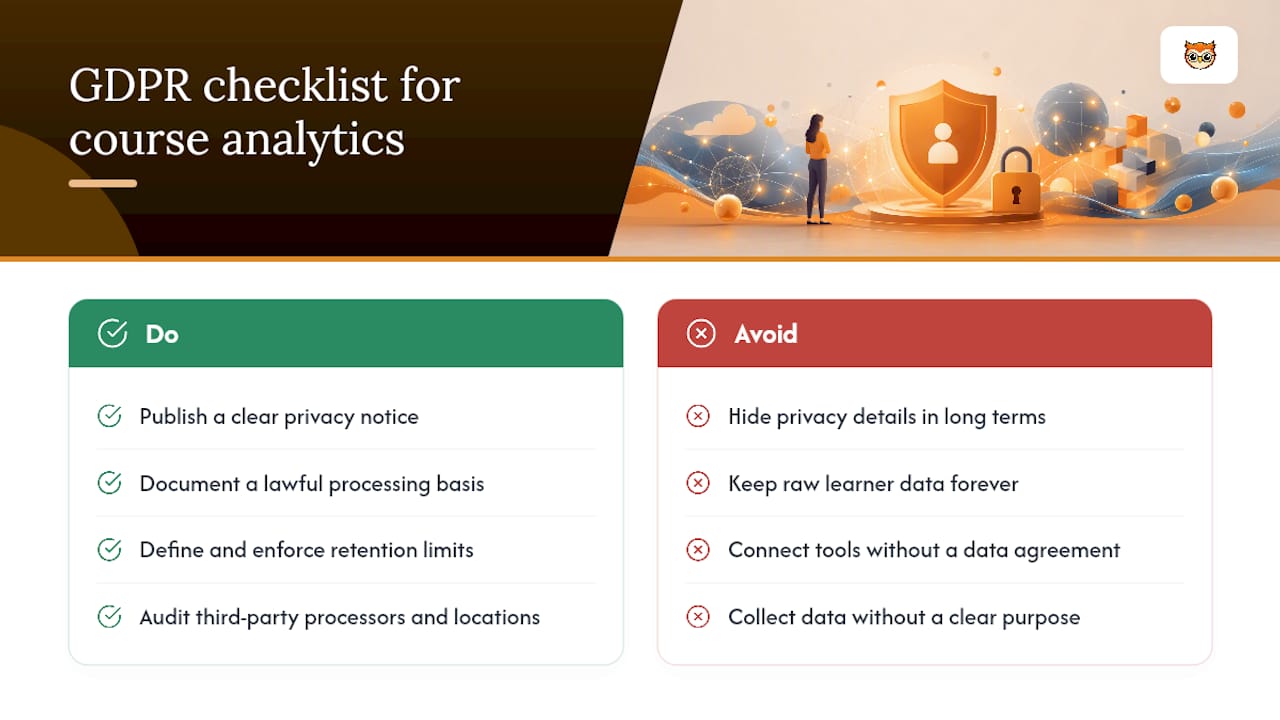
Practically, that means a few non-negotiables. Learners need a clear privacy notice explaining what you track and why, ideally in plain language rather than buried in a lengthy terms document nobody reads. You need a lawful basis for processing, usually contractual necessity for progress tracking and consent for anything used purely for marketing, such as retargeting students who didn't finish. Data retention should have a defined limit; keeping every quiz answer forever "just in case" is a liability, not an asset.
Third-party tools compound the risk. Every analytics tool, email platform or BI export you connect is another place learner data lives, and another agreement you need in place with that processor. Before wiring up a new integration, check whether it stores data inside or outside the EU/EEA, since that affects which safeguards you need.
None of this should stop you tracking the metrics covered earlier. It does mean building tracking with restraint: collect what you'll actually use to improve the course, and avoid hoovering up data points with no clear analytical purpose. A smaller, cleaner dataset is usually more useful than a sprawling one anyway.
Data quality: making sure your numbers can be trusted
Bad data is worse than no data, because it looks trustworthy right up until a decision built on it fails. Before acting on any dashboard number, it's worth running a few basic checks.
Start with duplicate events. If "lesson completed" fires twice for the same student on the same lesson, your completion rate will read higher than reality, sometimes significantly. Cross-check your event counts against a manual sample of ten or twenty students occasionally, rather than assuming the pipeline is fine forever.
Watch for identifier drift. A student who buys on one device and logs in on another needs to map to the same user ID, or your cohort comparisons will silently split one person into two records. This is one of the most common instrumentation pitfalls creators run into, and it's often invisible until someone actually audits the raw event log.
Sample size matters more than creators expect. Wait for enough volume before treating a lesson-level number as a real signal rather than noise.
Finally, timestamp your changes. If you rework a lesson on the 14th, tag every export and dashboard filter with that date so you're comparing genuine before-and-after cohorts, not blending old and new data into one misleading average.
Case studies: what analytics-led fixes actually look like
One recurring scenario involves a technical course where lesson three required a software installation step. Drop-off at that exact point ran far higher than any other lesson in the course. The fix wasn't more content, it was a two-minute setup video added before the lesson, cutting that specific drop-off substantially in the following cohort.

Another common pattern involves language cohorts. A course sold in English and a second language often shows a completion gap of ten to fifteen points between the two, not because the translated content is worse, but because translated instructions reference screenshots or terminology that no longer matches what the student sees. Cohorting by language surfaces this immediately; looking at blended totals hides it completely.
A third pattern sits around pricing tiers. Students on a discounted or bundled price frequently show lower activation than full-price buyers, since the course wasn't the primary reason they purchased. That's not a course quality problem, it's a targeting one, and treating it as the former leads creators to rework content that was never actually broken.
The common thread across all three: the fix only became obvious once the data was cohorted rather than viewed as a single blended average.
Predictive analytics and machine learning in course performance
Predictive tools are moving from novelty to standard feature across learning platforms, and the practical use case for most creators is narrower than it sounds: flagging students likely to drop off before they actually do, so you can intervene while there's still time to matter.
A predictive model typically looks at early signals, days since last login, lesson pace relative to the cohort average, quiz scores, and assigns a risk score. A student who hasn't logged in for eight days and scored poorly on the last quiz is a much stronger drop-off candidate than one who's simply progressing slowly but consistently.
The realistic value for a solo creator isn't building a machine learning model from scratch, it's using a platform that surfaces this kind of flag automatically, then acting on it with something simple: a check-in email, a nudge with a shortcut to the next lesson, or an offer of help. Interactive, predictive dashboards are becoming a baseline expectation on learning platforms precisely because manual monitoring doesn't scale past a handful of cohorts.
Treat predictive flags as a prioritisation tool, not a verdict. A model can tell you who's at risk; it can't tell you why, and the "why" is still something you diagnose using the lesson-level and cohort methods covered earlier in this piece.
Connecting course analytics to your LMS, CRM and marketing tools
Course analytics rarely lives in isolation. The real value shows up when learner data talks to the systems around it, your CRM, your email platform, and whatever hosts the course content itself.
An LMS integration matters most for course delivery data: lesson completions, quiz scores and time-on-content need to flow somewhere you can actually query them, rather than sitting locked inside a platform's native reporting screen. Platforms vary considerably here, and it's worth checking what alternatives support before switching, since export limitations discovered after migration are expensive to fix.
CRM integration turns analytics into action. A student flagged as at-risk in your course platform should ideally trigger a tag or a task in your CRM, not just sit in a dashboard nobody checks daily. The same applies to a student who just completed the course, that's your best upsell moment, and it needs to reach your marketing system automatically rather than depending on someone remembering to export a list.
Marketing platform integration closes the loop on ARPS and repeat purchases. If a $ 47 lead magnet reliably produces students who later buy a $ 400 flagship course, that connection only becomes visible when purchase history and email engagement sit in one place. Analytics tied to monetisation strategy across platforms tends to reveal which acquisition channel actually produces long-term customers, not just first purchases, which is a very different question from the one most creators start out asking.
A habit worth borrowing from creators who do this well
The creators who build sustainable course businesses treat completion and outcomes as the real scoreboard, not just sales. A weekly ten-minute check of activation and drop-off, paired with one small experiment a month, catches problems while they're cheap to fix. BibliOWLteca's cohort and export tools make that habit easy to sustain without needing a data background.
Get the analytics and commerce tools in one place
Most creators end up stitching together a course host, a separate analytics tool and a third system for payments, then trying to make the numbers from all three agree. BibliOWLteca is built the other way round: cohort dashboards, quiz performance and revenue data sit next to the payment and delivery infrastructure that actually generates them, so the metrics covered throughout this guide, activation, drop-off, ARPS, refund rate, are visible without exporting three spreadsheets first.
That matters most at the moment you're deciding whether a lesson fix worked or a launch underperformed, decisions that are hard to make quickly when your sales data and your learner data live on different platforms. BibliOWLteca's feature set covers course hosting with video and quizzes, multi-currency global payments, and built-in tax compliance, alongside the storefront tools creators need to sell e-books, courses and mentorship programmes side by side.
If you're currently checking three dashboards to answer one question about a cohort, it's worth seeing what a single connected platform looks like for your own course. Set up a storefront and pull your first cohort report to see where your current data gaps actually are.
Frequently asked questions
What is a good completion rate for an online course? Completion rates vary enormously by course type and length, so treat any generic benchmark cautiously. What matters more is your own trend across cohorts: a rate that's climbing after you fix a specific lesson tells you more than a static number ever will.
How often should I check my course analytics? A weekly glance at activation and drop-off catches problems early enough to fix before a launch's reputation suffers. Reserve deeper cohort comparisons and revenue audits for monthly reviews, paired with one small experiment each cycle.
What's the difference between engagement and completion metrics? Engagement measures activity within lessons, time spent, sessions, video watch-through, while completion measures whether someone finished the whole course. A student can be highly engaged in early lessons and still drop off, which is exactly why lesson-level drop-off data matters more than either metric alone.
Do I need a data analyst to use course analytics properly? No. The workflow described here, detect a signal, cohort it, inspect the lesson, test a change, measure the result, is designed to run on a dashboard, not a spreadsheet full of formulas. A platform with built-in cohorting removes most of the technical burden.
How does course analytics affect refund rates? Refunds usually cluster around a specific lesson, price point or expectation mismatch rather than being random. Tracking refund timing alongside lesson-level drop-off often reveals the exact point in the course where expectations and delivery diverged.
Sources
- LMS Analytics: What to Track and How to Use Your Data
- Key Metrics in Learning Management System Analytics for 2026
- 2026 Q2 Revenue Audit: 5 Metrics Every Course Creator Must Track