
Sales analytics means measuring the specific actions that turn a visitor into a paying customer, then acting on what you find. Get three things right first: pick a small set of critical KPIs, instrument them reliably with proper events and a dataLayer, and run a short test-and-learn loop on whatever the numbers flag. Tools like Google Analytics handle the measurement; a platform like BibliOWLteca handles what happens after someone decides to buy.
TL;DR:
- Tracking conversion rate and cart abandonment provides the clearest view of sales performance, especially for high-volume e-commerce businesses.
- Proper instrumentation requires firing consistent events with accurate parameters, including product details and currency, via the dataLayer for reliable reports.
- Privacy-conscious tools like Matomo and Plausible are effective substitutes or supplements to GA4 when handling consent-sensitive audiences.
- Combining quantitative funnel data with qualitative insights from session recordings and heatmaps helps diagnose the true causes of conversion issues.
- Focused KPIs and weekly reviews of a small set of metrics outperform complex, unfocused dashboards and foster continuous sales improvement.
Table of Contents
- Core sales KPIs every business should track
- Tools and trade-offs: GA4, tag managers and privacy-first alternatives
- Instrumentation essentials: events, ecommerce events and the dataLayer
- Use qualitative signals: session recordings, heatmaps and form analytics
- Data quality, consent and how privacy settings change what you measure
- Turn analytics into action: a practical 5-step playbook
- How BibliOWLteca supports creators with sales analytics and practical resources
- Sales forecasting techniques using analytics
- Integration of sales analytics with CRM and marketing automation tools
- Case studies or examples of actionable insights derived from sales analytics
- Common analytics mistakes and what to do instead
- An adjacent route for creators who want sales reporting built in
- Sources
- FAQ
Core sales KPIs every business should track
Five numbers explain most of what goes wrong (or right) in a sales funnel. Conversion rate tells you what share of visitors buy. Average order value (AOV) shows how much each transaction is worth. Cart abandonment flags where people bail before paying. Customer lifetime value (CLV) puts a number on long-term worth per customer, and customer acquisition cost (CAC) tells you what you're paying to get them there.
Weighting differs by model. A B2B seller with a long sales cycle should watch CAC and CLV closely, since a single lost deal costs more than a dozen abandoned carts. E-commerce operators live and die by conversion rate and cart abandonment, because volume is high and margins are thin. Course creators sit somewhere between the two: AOV and CLV matter more once someone has bought a first module, because repeat purchases and upsells drive most of the profit.
The mistake most people make is tracking fifteen metrics and acting on none of them. Start with a tighter set instead:
- Conversion rate (site-wide and per funnel step)
- AOV
- Cart or checkout abandonment rate
- CAC by channel
- CLV over a rolling 12-month window
Four to six KPIs, reviewed weekly, beats a dashboard nobody opens.
Tools and trade-offs: GA4, tag managers and privacy-first alternatives
Google Analytics (GA4) remains the default for ecommerce and event-driven reporting. It's built to track a shopping journey step by step, from product view through to purchase, and its reports are free at meaningful scale. Google Tag Manager sits alongside it, letting you deploy and adjust tracking tags without touching site code every time marketing wants a new pixel.
Where GA4 struggles is privacy. If your audience is consent-sensitive, or you want data you fully control, Matomo or Plausible are worth running instead, or alongside GA4, since they can preserve near-complete visitor counts without relying on consent banners.
Session-capture tools like Hotjar or Crazy Egg trade some privacy exposure for diagnostic power. They show you exactly where someone hesitated or gave up, which no funnel report can do on its own.
Pro Tip: Run GA4 for trend reporting and a privacy-first tool for a sanity check on absolute numbers. If the two disagree by more than a small margin, consent loss is probably the reason, not a tracking bug.
Instrumentation essentials: events, ecommerce events and the dataLayer
Reliable measurement starts with the right events firing at the right moments. For any online sales flow, send at minimum:
view_item_listwhen a product or course category is browsedview_itemwhen a single product page loadsadd_to_cartwhen an item is addedbegin_checkoutwhen checkout startsadd_payment_infowhen payment details are enteredpurchasewhen the transaction completesrefundif and when money goes back
Each event needs consistent parameters. Currency should be set at the event level every time, alongside a value and an item array listing product ID, name, and price, as Google's own ecommerce measurement guidance specifies. Skip a parameter on one event and inconsistent, or missing, and your reports develop gaps that are hard to trace back later.
The dataLayer is what makes this reliable rather than fragile. Instead of tagging tools scraping page elements that change every redesign, the dataLayer pushes structured event data that any tag can read, which is why it's considered instrumentation best practice rather than an optional extra. Verify implementation with GA4's DebugView, since standard reports can take up to 24 hours to populate and DebugView shows events landing in real time.
Use qualitative signals: session recordings, heatmaps and form analytics
Numbers tell you that people are dropping off at checkout. They rarely tell you why. That's the point to bring in session recordings and heatmaps, once a quantitative funnel report shows the same drop-off happening week after week rather than a one-off blip.
When reviewing recordings, watch for:
- Payment errors that never surface in your analytics because the user simply gives up
- Buttons that look clickable but don't respond on certain devices
- Form fields that cause confusion or repeated correction attempts
Sample rather than watch everything. A few dozen sessions from the exact step that's underperforming will usually reveal a pattern. Keep masking switched on for sensitive fields, and respect whatever consent state the visitor gave, since recording tools capture far more personal detail than a standard pageview ever does.
Data quality, consent and how privacy settings change what you measure
Consent choices directly shrink your numbers. When a meaningful share of visitors decline tracking, absolute totals in GA4 can understate real traffic and conversions substantially, sometimes dramatically, depending on your audience and market.
The fix is not chasing the missing visitors. It's changing what you rely on:
- Favour ratio metrics (conversion rate, abandonment rate) over raw counts, since they hold up better when consent rates shift
- Turn on GA4's consent mode to model some of the gap, but treat modelled figures as an estimate, not a fact
- Run a self-hosted or privacy-first tracker such as Matomo in parallel if you need a trustworthy absolute number for board reporting or investor updates
Parallel tracking costs a little setup time. It's worth it the moment a single source of truth stops being trustworthy on its own.
Turn analytics into action: a practical 5-step playbook
Data without a process just sits there. Follow five steps every time a metric looks wrong:
- Define the KPI you're trying to move and its current baseline
- Instrument it properly, checking events fire with correct parameters
- Diagnose using both the funnel numbers and session recordings, so quantitative and qualitative evidence point the same direction
- Design and run an experiment aimed at the specific step that's underperforming
- Measure and iterate, comparing against the baseline you defined in step one
Prioritise by impact times ease.
Pro Tip: Start with a minimum viable experiment rather than a full redesign: a pricing banner test on a course landing page, a one-field-shorter checkout form, or a single cart-recovery email. Small, fast tests reveal more than big, slow ones.
How BibliOWLteca supports creators with sales analytics and practical resources
Creators selling e-books, courses, or templates need sales numbers baked into the platform, not bolted on afterwards. Some platforms offer built-in sales reporting showing revenue by product and currency without needing a separate dashboard, which matters when payments arrive in multiple currencies from a global audience.
For deeper reading, the platform's own guides cover course analytics and revenue protection and a GDPR checklist for course sellers, both worth a read before wiring up external tracking.
Sales forecasting techniques using analytics
Forecasting only works as well as the data feeding it. The most reliable starting point is a weighted pipeline forecast: multiply expected deal value by a probability estimate for each stage, then sum across the pipeline. It's simple, transparent, and hard to game.
Cadence matters more than the model you choose. Teams that review and clean their pipeline data weekly produce more accurate forecasts than teams running a sophisticated model on stale or messy CRM records. That's true whether you sell enterprise software or digital courses; the mechanics differ, the discipline doesn't.
For e-commerce and creator businesses, a simpler trend-based forecast often works better than a pipeline model, since there's no discrete deal stage to track. Take trailing 90-day revenue, adjust for seasonality if your product has any (course launches tied to academic terms, for instance), and project forward. Add a conservative and optimistic band rather than a single number, since a single figure invites false confidence.
Only reach for AI-assisted or multivariable forecasting once you have 18 to 24 months of clean historical data. Feeding a model incomplete or inconsistent activity data produces a forecast that looks precise and is actually worse than a spreadsheet estimate. Data hygiene beats model sophistication almost every time at this stage.

Integration of sales analytics with CRM and marketing automation tools
Analytics platforms measure behaviour; CRMs and marketing automation tools store the customer relationship. Connecting the two closes the loop between "someone did X on the website" and "someone bought Y three weeks later," which raw website analytics can't show on its own.
The practical version of this, for a creator or small e-commerce team, usually means a few concrete links rather than a full enterprise integration. Course or product purchase events should flow into your CRM or email tool so a buyer's tag updates automatically, triggering the right onboarding sequence instead of a generic newsletter. Abandoned checkout events should trigger a recovery email through your marketing automation tool within a few hours, while intent is still warm.
Attribution is where this gets genuinely useful. If GA4 shows a spike in course page views from a particular video or campaign, tying that traffic source through to actual purchases in your CRM tells you whether that channel is worth repeating. Without the connection, you're left guessing whether views translated into revenue at all.
Creators who publish video content often see the clearest version of this gap: a video drives traffic, but without linking platform metrics to purchase data, it's impossible to know which video actually sold anything. Reviewing YouTube channel metrics alongside on-site conversion data closes part of that gap for video-led creators.
Keep the integration narrow at first: one trigger, one automation, one metric you check weekly. Expand only once that single link is proven to work.

Case studies or examples of actionable insights derived from sales analytics
Session recordings often reveal the actual cause: a currency mismatch, where the displayed price didn't match the visitor's expected currency, quietly killing trust at the exact moment someone was ready to buy. Fixing the currency display, rather than redesigning the whole page, is usually the higher-impact move.
An e-commerce shop watching cart abandonment climb after a checkout redesign is another familiar case. Comparing begin_checkout to purchase events before and after the change, the funnel report alone won't say why abandonment rose. Heatmaps on the new checkout page frequently show users repeatedly clicking a shipping field that looked interactive but wasn't, a UI bug invisible in the aggregate numbers.
A B2B-style consultative seller tracking CAC by channel might find that one channel produces cheap leads but a far lower CLV once accounted for over 12 months. The instinct is to keep the channel because CAC looks good; the correct move is often to shift budget toward a channel with higher CAC but proportionally higher CLV, since acquisition cost alone is a misleading number in isolation.
In each case, the insight came from combining a quantitative gap with a qualitative or cross-metric check, not from staring at a single dashboard number.
Common analytics mistakes and what to do instead
The biggest trap is measuring everything and acting on nothing. Run a focused 90-day sprint instead: pick four KPIs, fix your instrumentation, and commit to a weekly review. Data hygiene and consistent cadence beat sophisticated models early on. Simple, repeated tests, checked against clean numbers, outperform complex forecasting before the fundamentals are solid.
— BibliOWLteca
An adjacent route for creators who want sales reporting built in
Running GA4 and a tag manager gives you granular control, but it also means stitching together several tools before you see a single useful number. BibliOWLteca's Creator Plan takes a different route for people selling e-books, courses, or templates: sales reporting, multi-currency payments, and digital delivery are already connected, so revenue by product and currency shows up without any dataLayer configuration at all.
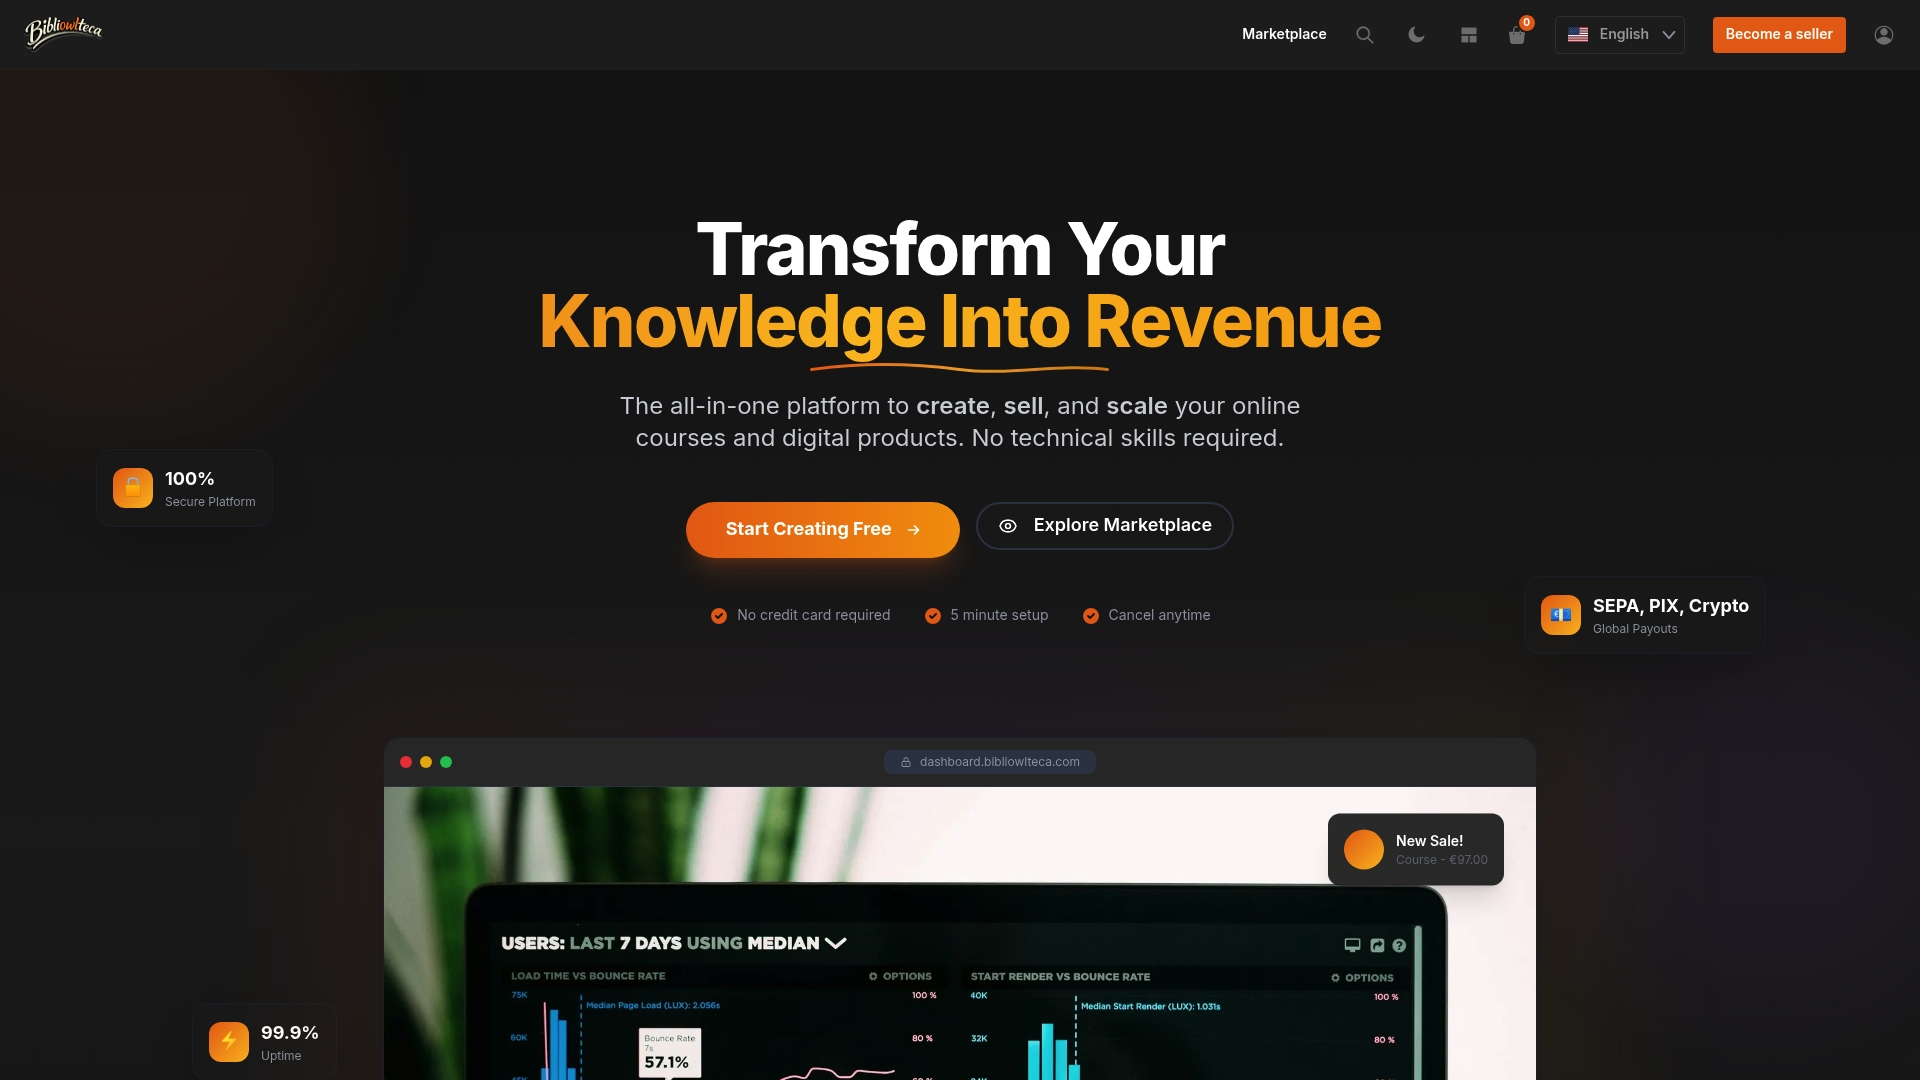
It isn't a replacement for GA4 or Matomo if you need funnel-level behavioural detail; pair it with one of those for deeper diagnostics on your storefront pages. But for the core question most creators actually ask, which product sold, in which currency, to how many buyers, the built-in reporting answers it without extra setup. Browse the ebooks, courses, and template categories the platform supports, and open a storefront to see your first sales report populate automatically.
Sources
- Measure ecommerce | Google Analytics | Google for Developers
- GA4 Recommended events - Analytics Help
- Erinevad analüütikatööriistad ning nende roll klienditeekonna optimeerimisel
- The Sales Forecasting Framework: A Complete Guide
FAQ
What is müügi analüütika in simple terms?
It's the practice of measuring the specific actions, page views, cart adds, checkouts, that drive revenue, then using those numbers to decide what to fix or test next. It covers both the KPIs you track and the tools, like GA4, used to collect them.
Which sales KPI should I track first?
Conversion rate is usually the best starting point, since it directly reflects whether your existing traffic is turning into revenue. Add average order value and cart abandonment once conversion rate is stable and being reviewed weekly.
Is GA4 GDPR-compliant on its own?
GA4's consent mode can model some data for visitors who decline tracking, but modelled figures have real limits and shouldn't be treated as exact totals. Many businesses run a privacy-first alternative like Matomo alongside GA4 for a trustworthy absolute count.
How much does BibliOWLteca's Creator Plan cost?
Pricing for the Creator Plan is listed directly on the BibliOWLteca pricing page, alongside the transaction fee structure, which starts from €0.99 per sale.
Do I need session recordings if I already have GA4?
GA4 shows you where visitors drop off; session recordings show you why. Once a funnel report reveals a repeatable problem step, a small sample of recordings from that exact step usually explains the cause faster than more dashboard analysis would.